Inveterate dabbler in business, travel, gadgets & life

Cluster analysis of my cycling speed versus distance

A very interesting, for me, cluster analysis of my cycling speed versus distance made using the Strava Wind Analysis website

As you can see the shorter the distance ridden the slower I ride 🙁 Obviously when I’m touring on a loaded bike I ride much shorter distances.

Geoff Jones cycling speed versus distance
Cycling ride distance versus speed

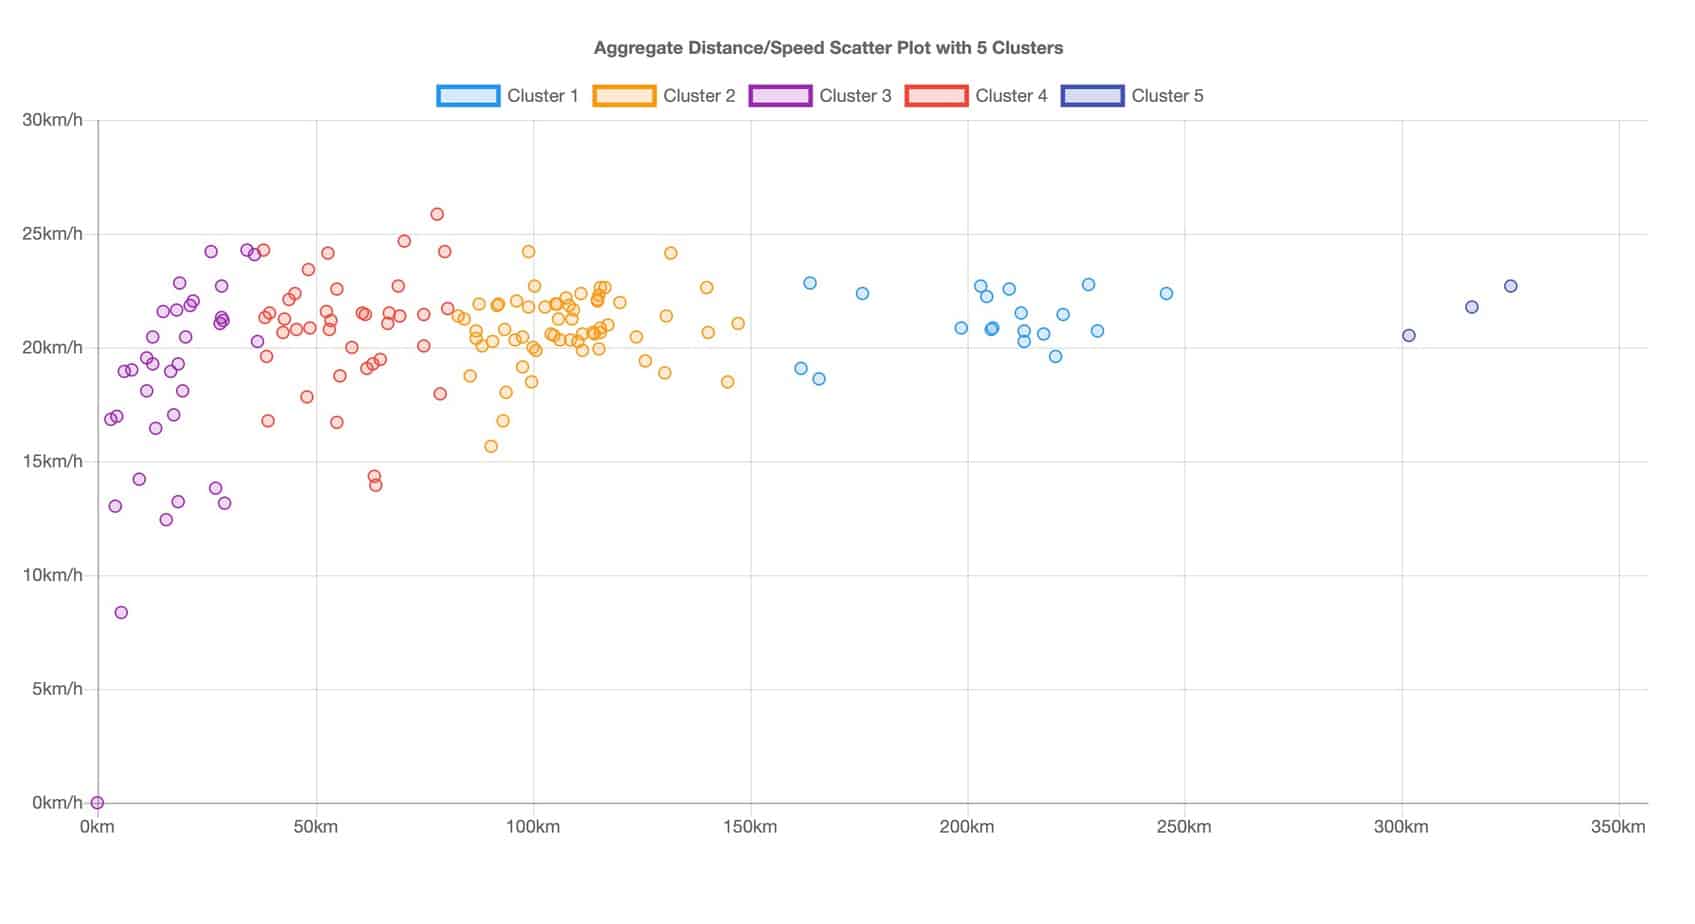
Interesting that my speed on Audaxes is always between 20 kph to 23kph irrespective of distance, well upto 300km 🙂 anyway.

The fastest ride is the 25.9kph ridden with Sally’s TTT group on my Fixie.
[mc4wp_form id=”18774″]
nbsp;

Falling of a cliff!

Interesting to see the latest number of UK House sales plotted by Dougal as you can see quite a cliff edge.

In May 2019 there were only 25,335 sales the previous lowest was in Feb 2009 with 28,507 sales. So this is the lowest monthly sales figures in at least 24 years! Will be very interesting to see when this gets reflected in price reductions.

UK Monthly Property_sales

Elevate your Strava

Geoff Jones Cycling distances
Mileage Comparison Chart

Using the excellent Chrome Elevate for Strava extension  I have now produced this pretty chart.

As you can see my cycling distance is now down  1,537 miles from the same date in 2018, meaning if I’m to do the same mileage as last year I have to now pedal 6,374 miles in the remaining 188 days of 2019 or 34 miles a day 🙂

I had better leave the computer and get on the bike and do my 34 miles 🙂

Oops forgot the bike computer stuff was all in km so the ride was only 23.7 miles 🙁 instead of the required 54km

Overview of our Camino Invierno walk

Finally 12 days after returning home from my Camino Invierno walk I’ve found a method of displaying all the sections where we walked on a zoomable embedded map 🙂 and amazingly also clearly showing all the bits we missed either intentionally or by error 🙁

The solution I found was to use the -umaps website which I found from this handy table on the OSM web wiki pretty straightforward to use as well.

&

See full screen

Pretty impressive use of Open Street Map 🙂

The spreadsheet I created whilst away shows I walked about ⅔ of the route or about 90 miles in 7 walking days with over 10,000 feet of climbing, all very pleasant on very quiet tracks and roads so it makes a good alternative to the very busy Camino Francais, apart from the lack of accommodation on the route.

Use the spreadsheet to find all the relevant blog posts, Strava route details & my Flickr photos

Many thanks to Colin for the invite and organisational skills plus many thanks to German Geoff for staying with us even with his Achilles injury and supporting us with Colin’s car, certainly made it a lot easier!