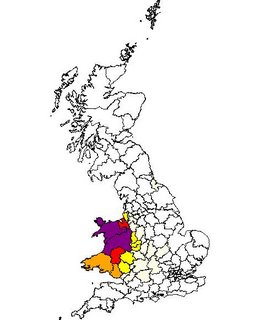
An excellent and fun tool from the Centre for Advanced Spacial Analysis enabling you to check the distribution of your surname in the UK (excluding Ireland) for the years 1881 and 1998. The map is for Jones in 1881
Purple areas are the highest concentrations (then red > orange >yellow > white)
You may also like these posts:
Reader Comments
Comments are closed.


Turns out Jones is pronounced “hoe-ness.”
See here.